


The recent extreme hot weather brought Londoners together in a way, with everyone talking about their struggles in the heat.
But not every part of Southwark was affected as much as others.
Heat data mapped by 4 Earth Intelligence and shared with the News shows how susceptible to heat each different postcode area in the borough is, compared to the neighbourhoods around it.

As you might imagine, areas with less green space and shade are more likely to heat up than neighbourhoods with those amenities.
4 Earth Intelligence ranked areas across the whole of the UK on a scale of one-five, with five being the most susceptible to heat and one being the least. They then colour-coded the areas from dark red down to beige, depending on how badly they are affected.

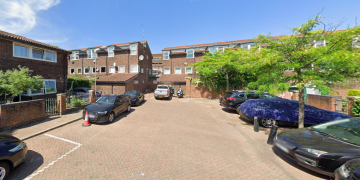
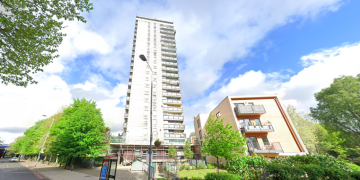
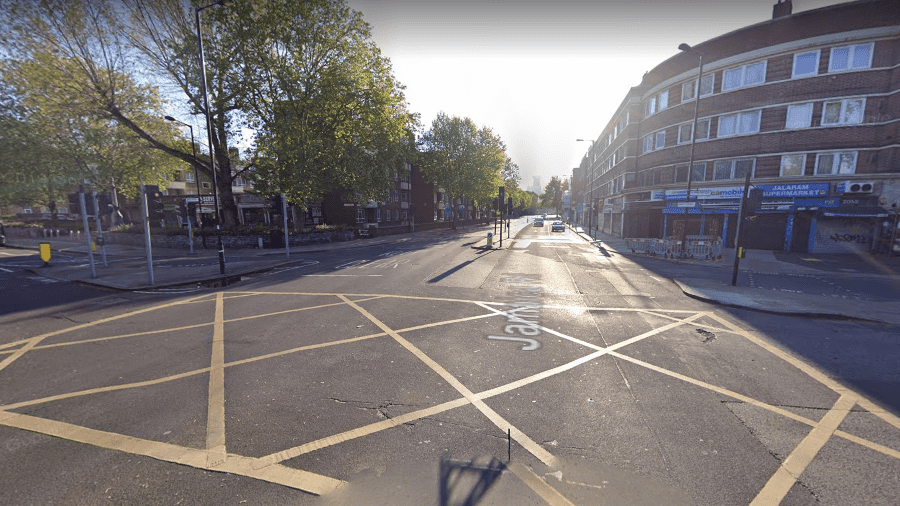
In Southwark, the hottest parts tend to map onto the more densely-populated parts of the borough.
For example, parts of the area around the Old Kent Road, Peckham, south Bermondsey and Canada Water all score a five.

The south of the borough, including parts of Dulwich and Sydenham, are much less susceptible to heat, because they are surrounded by green spaces.
Analysts at 4 Earth Intelligence looked at ground-level temperature over the past three summers to calculate the heat hazard level of each area.
Relatedarticles


The data shows how important green spaces in cities will be if temperatures continue to rise in the years and decades to come, as many forecasters predict. A widely-cited study by Richard Mitchell and Frank Popham from 2008 suggested that people in the UK who live close to green space in a city would be more likely to live longer on average than those who did not.
